- Gold prices rally on Thursday, set for best week since the beginning of April
- Significant disappointment in ISM Price Paid data boosted Fed rate cut bets
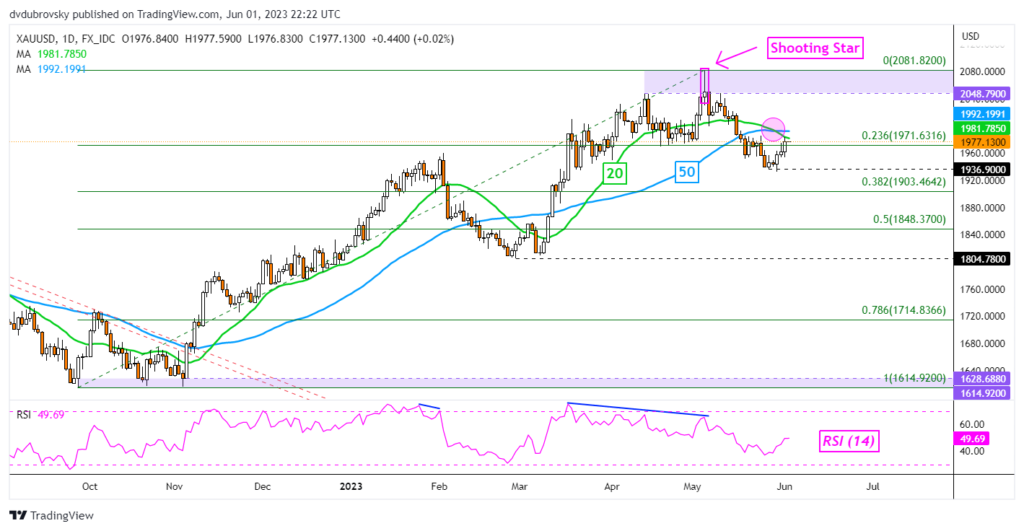
- XAU/USD technical bias remains downward due to a Bearish Death Cross
Gold Finds Momentum on US ISM Data Disappointment
Gold prices rallied over 0.7 percent on Thursday, bringing total gains this week so far to about 1.6. This is setting up to be the best week for the yellow metal since the beginning of April. A closer look reveals that XAU/USD has been rising while the US Dollar and Treasury yields have been weakening, underscoring the anti-fiat properties of gold.
Over the past 24 hours, US ISM Manufacturing clocked in at 46.9 for May, lower than the 47 estimate. But, what was more surprising is that prices paid crossed the wires at 44.2, significantly lower than the 52.3 forecast. A reminder that values below 50 indicate contracting activity and vice versa. Effectively, the data underscored that the cyclical component of the economy is continuing to contract.
Now, prices are seemingly following lower, which added fuel to the story that perhaps inflation may continue weakening in the near term. As a result, financial markets have been quick to price rate cuts back from the Federal Reserve, hence falling yields and a softer currency. Wall Street absolutely rejoiced with this news, with the Nasdaq 100, S&P 500 and Dow Jones rallying hard.
This is the current market environment we find ourselves in given that the central bank has signaled a pause, with the near-term path to remain heavily data-dependent (this includes both the probability of hikes and cuts). One day the central bank’s preferred inflation gauge drives up rate hike bets, today ISM data pours cold water on it.
Looking into the remaining 24 hours, the Asia-Pacific trading session is lacking notable economic event risk. Instead, gold will be highly anticipated US non-farm payrolls data which is due at 12:30 GMT. Understand that another solid print could reverse the market reaction seen on Thursday if it gets traders to think about the possibility of further Fed tightening, once again diminishing gold’s appeal.
Gold Technical Analysis
Gold prices face the next critical technical obstacle on the daily chart below. A bearish Death Cross between the 20- and 50-day Simple Moving Averages formed recently, offering a downside technical bias. Prices have rallied up to the 20-day line, which may hold as resistance, with the 50-day equivalent shortly after. As such, these could reinstate the downside focus. Key support seems to be at 1936.
